IDAHO ED NEWS PUBLISHES
k-12 EDUCATION POVERTY INDEX
Last month, Idaho Education News published a k-12 poverty index. Well, it was really a ranking of schools they developed using State Department of Education ESSA data, which were all highly correlated with poverty.
Everyone loves a ranking system. It's interesting to see where businesses or football teams or public schools line up in the rankings. With schools, though, you get what you get, and kids are not widgets. We don't throw out those that don't fit, who have special needs or don't speak the language. We educate them all, so it's important to consider the factors that affect their education.
And these factors make it necessary to get creative to serve kids' needs. Schools with high populations of free/reduced and/or Limited English students desperately need services that will put them on a more level playing field with Longfellow in Boise or Paramount in West Ada, such as:
- Early learning services such as pre-k and full day kindergarten.
- Community Schools services that provide wrap-around services so kids can come to school ready to learn.
- College-ready programs such as AVID (Boise, Mt. Home, and Vallivue) and P-16 (Caldwell) that give kids the tools they need to navigate the college process and the confidence they must have to succeed.
- Scholarship programs established with benefactors from the business world to help them afford the costs of post-secondary.
These programs will go a lot further in improving success and "Go-on" rates for our kids than a list contrived to congratulate some districts and schools and punish others based on their poverty levels.
However, the success of a school’s more creative approaches to learning requires much more effort, understanding and context.
In compiling their list, IEN doubled-down on the data, using data from the Idaho Department of Education's 2018 ESSA plan calculations, combining composite values of all schools, elementary, secondary, alternative, and other configurations into a big list to show which schools are the top (and bottom) "performers". These composites are basically aggregate measures of status and growth on the SBAC, with grad rates and a couple of other measures thrown in.
After IEN posted their rankings, they were besieged with comments from those who wished to critique their methodology, which clearly had some issues. But that's not really the point. Every measure used by the SDE as part of its plan was highly correlated with poverty. So why not just use poverty levels for the rankings?
We looked at IEN's lowest and highest ranked schools, adding free/reduced lunch status and LEP population percentages as factors to consider, in order to add some context to the rankings, and to illustrate just how closely they are related to free/reduced lunch and Limited English populations at the schools.
Here are bottom elementary schools in the state, as ranked by IEN.
However, the success of a school’s more creative approaches to learning requires much more effort, understanding and context.
In compiling their list, IEN doubled-down on the data, using data from the Idaho Department of Education's 2018 ESSA plan calculations, combining composite values of all schools, elementary, secondary, alternative, and other configurations into a big list to show which schools are the top (and bottom) "performers". These composites are basically aggregate measures of status and growth on the SBAC, with grad rates and a couple of other measures thrown in.
After IEN posted their rankings, they were besieged with comments from those who wished to critique their methodology, which clearly had some issues. But that's not really the point. Every measure used by the SDE as part of its plan was highly correlated with poverty. So why not just use poverty levels for the rankings?
We looked at IEN's lowest and highest ranked schools, adding free/reduced lunch status and LEP population percentages as factors to consider, in order to add some context to the rankings, and to illustrate just how closely they are related to free/reduced lunch and Limited English populations at the schools.
The IEN Elementary Schools
Here are bottom elementary schools in the state, as ranked by IEN.
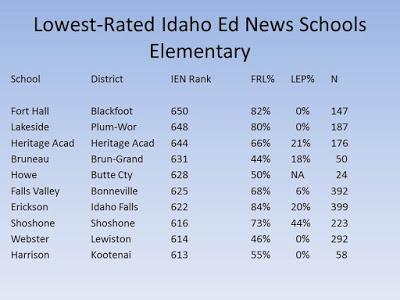

The more you look at these data, the more you understand that the information used by IEN for their rankings really does reflect poverty and language barriers more than anything else. There are some anomalies, such as Webster in Lewiston and Teed in Kuna; otherwise, the data show that these schools serve impoverished communities around the state of Idaho.

Among the very highest IEN-ranked elementary schools, we see names that have been high SBAC performers since the test was initiated in Idaho - those with low free/reduced lunch percentages and few Limited English students. These schools should perform well on this test, which favors students with a wealth of experience.

In the next group of elementary schools from the IEN rankings, we see more of the same. A number of schools listed here have little diversity, and low levels of poverty and Limited English.
There are a few exceptions here, though. Rulon Ellis Elementary in Pocatello, Discovery in Bonneville, Chief Joseph in West Ada, and Westside in Idaho Falls all have FRL percentages closer to the state average, and Chief Joseph and Westside have higher LEP percentages. These are schools at which we should look for example of high achievement with challenged populations.
The IEN Junior Highs/Middle Schools
At the middle school/junior high level, the picture is much the same. Check out the lowest ranked schools, and you'll see:

Most of these middle level schools have very high percentages of free/reduced lunch. The two that have lower percentages have large numbers of Limited English students.
For the most part, the highest ranked middle level schools are the opposite in configuration.

As you might suspect, the high school data show the same patterns. Idaho Ed News has effectively created an index of school poverty, with very few exceptions.
It's kind of like looking at the SAT data without a filter. Yes, Boise, Madison, Timberline, and McCall all do well. They should, and as a matter of fact they exceed expectations in their performance. But when you examine the data considering the free/reduced lunch data, you find that the schools with the best performance are...Caldwell and Fruitland.
With the state’s so-called accountability system finally falling into place, as well as the Governor’s welcomed emphasis on literacy, it will be more important than ever to cast a critical eye toward any seemingly simple “ranking” of schools. Behind every measurement focused on first and worst there are real students facing real barriers to learning and succeeding. Let’s not lose sight of that.